Open statistics views
All registries managed by UCR will have the ability to reach out to an interested public with basic statistics that are updated continuously. We will do this by using the BI tool SAS and producing so-called report packages that are accessible via the registry's external website.
Target group and purpose
The open statistical views can be accessed by people who are looking for information about the disease area and then find the registry's website. Target groups are primarily patients and relatives, but also people who work in the healthcare profession or are otherwise affected and want to understand more.
The purpose of publishing open statistics is to give an insight into the area the registry covers. It could also be to highlight how care differs between different parts of the country, both in terms of patient background but also results. Unlike the reports that are produced for care units and used during login, the open statistics views need to show aggregated data where individual individuals cannot be revealed.
As the statistics displayed via the registry's website reach a broad target group, for example patients and relatives who lack deeper medical knowledge, it is important to consider that the content should be easy to absorb even for these target groups.
Structure and parts
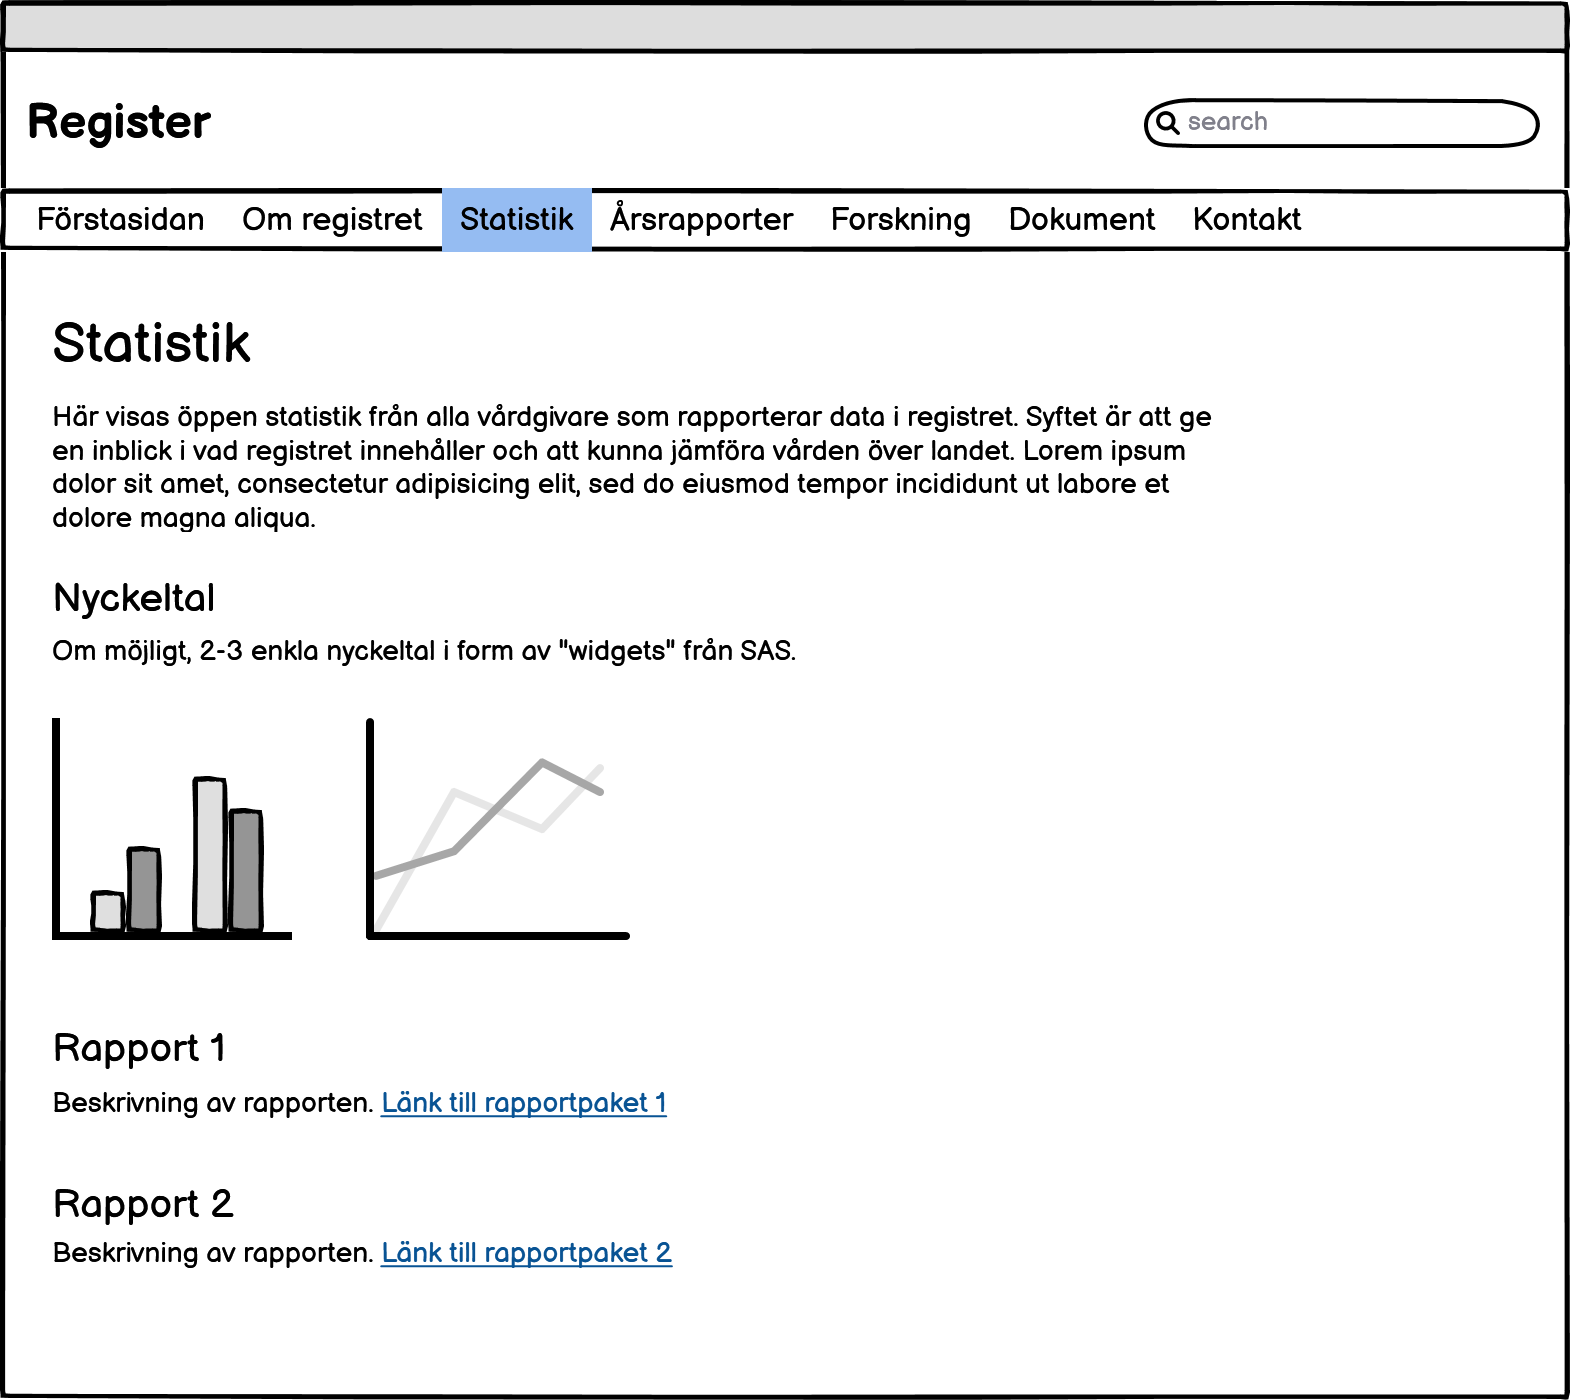
Public report packages are made available via the registry's external website, under a separate entry ("Statistics") with an overview page - see sketch in Swedish below.

The overview page should briefly describe the purpose and give an introduction to the statistics that are available in the report packages and preferably show a couple of simple key figures from the registry directly on the page. There must then be links to one or more report packages. When clicking on a report package, a new tab/page opens with the possibility to interact with the statistics.
- To make it easier for the user, there should be a clear question per report package.
- It may be useful to include some basic data, such as the degree of coverage of units and the number of registered procedures/patients.
Assume that the person seeing the statistics is not used to looking at this type of data. It is important to help the user understand by using clear, informative headings and help texts.
Restrictions
With report packages, you can do a lot, but not everything. Above all, report packages are suitable for:
- Reports with simpler types of interaction. No graphs affecting other graphs.
- Reports that have a limited number of selection parameters. The number depends entirely on the data and whether the parameters are multi-choice or single-choice. But 3-4 should be fine.
- Reports showing means/averages. Media cannot be used in report packs.
Suggestions for general text for the overview page:
Open statistics from all care providers who report data in registry X are shown here. The aim is to give an insight into what the registry contains and to be able to compare care across the country.
The statistics should be a source of knowledge, regardless of whether you yourself are a patient, a relative, work in the care profession or are otherwise affected and want to understand more.
Keep in mind that this data alone is not sufficient to create a picture of how care and individual units work. There are many factors that need to be considered that cannot be reported here, such as how the patient record looks for different units. The results reported should rather be seen as a basis for discussion to be analyzed further to find potential for improvement._