Key figures
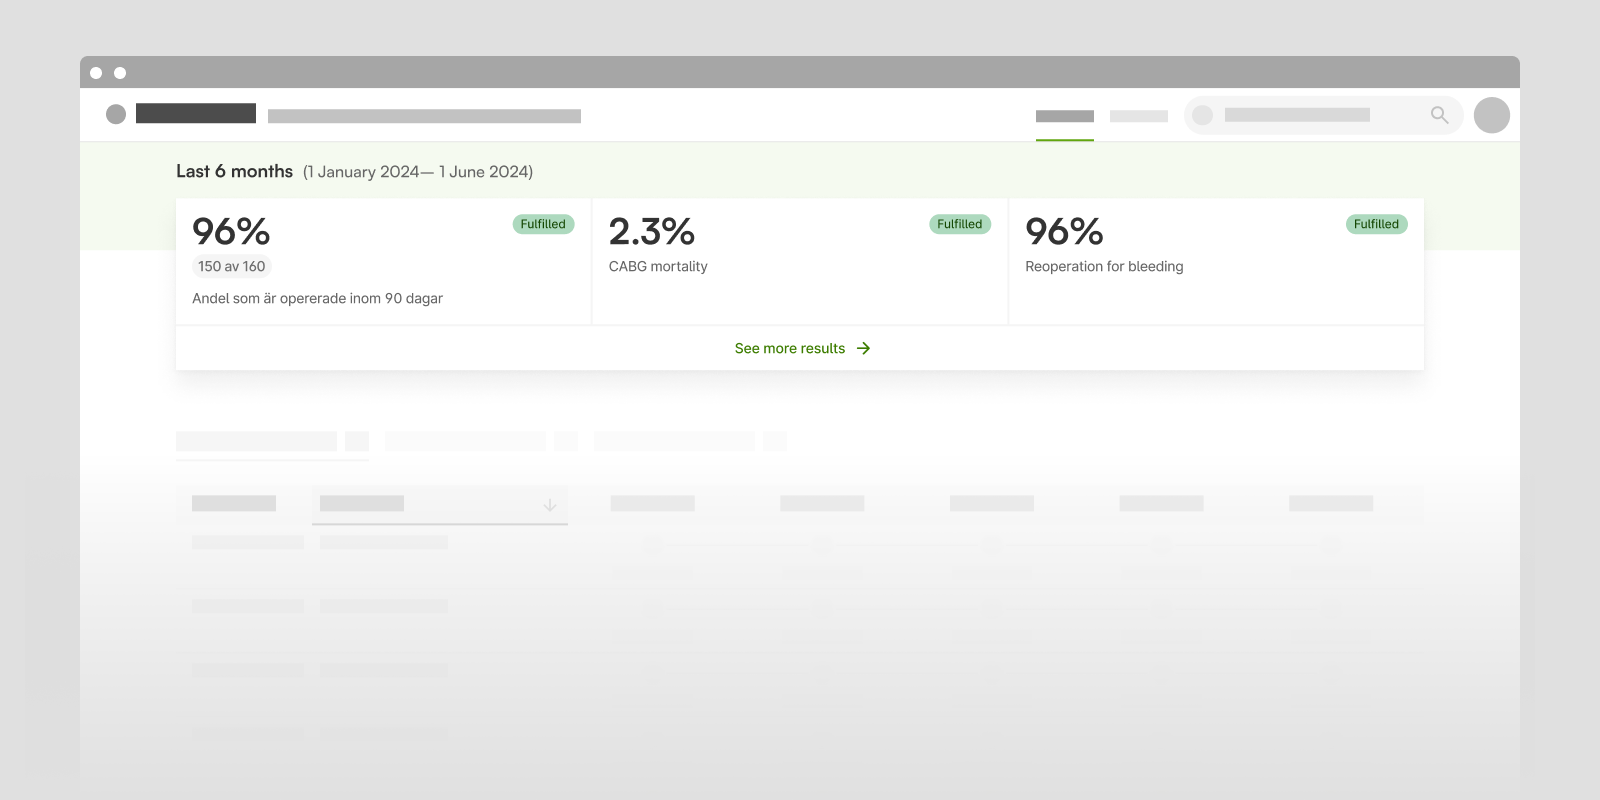
It is possible to display a panel with key figures, showing the registry's results, on the registration overview.
The purpose of the key figure panel is to make more users curious about, and engage with, the results and reports, thereby increasing the use of data in improving healthcare.
As the panel is intended to spark interest and serve as an entry point to the registry's reports, it is kept simple and uniform regarding the information displayed and the settings for time intervals. Other options for controlling and displaying results with graphs and charts, and making various selections, are available in the registry's reports.
Available combinations
Each key figure has a name, a value (e.g., a number or percentage), and a text describing the key figure. If the value is a percentage, it is possible to also display the numerator and denominator, for example, "90 out of 200". It is possible to show goal fulfilment with threshold values (fulfilled, partially fulfilled, not fulfilled).

- Basic Version: This is a key figure with a short description.
- Key Figure with Numerator and Denominator: When you want to clarify percentages, for example.
- Key Figure with Goal Fulfilment: Ability to show the status of goal fulfilment.
- All variants: with numbers, goal fulfilment and description.
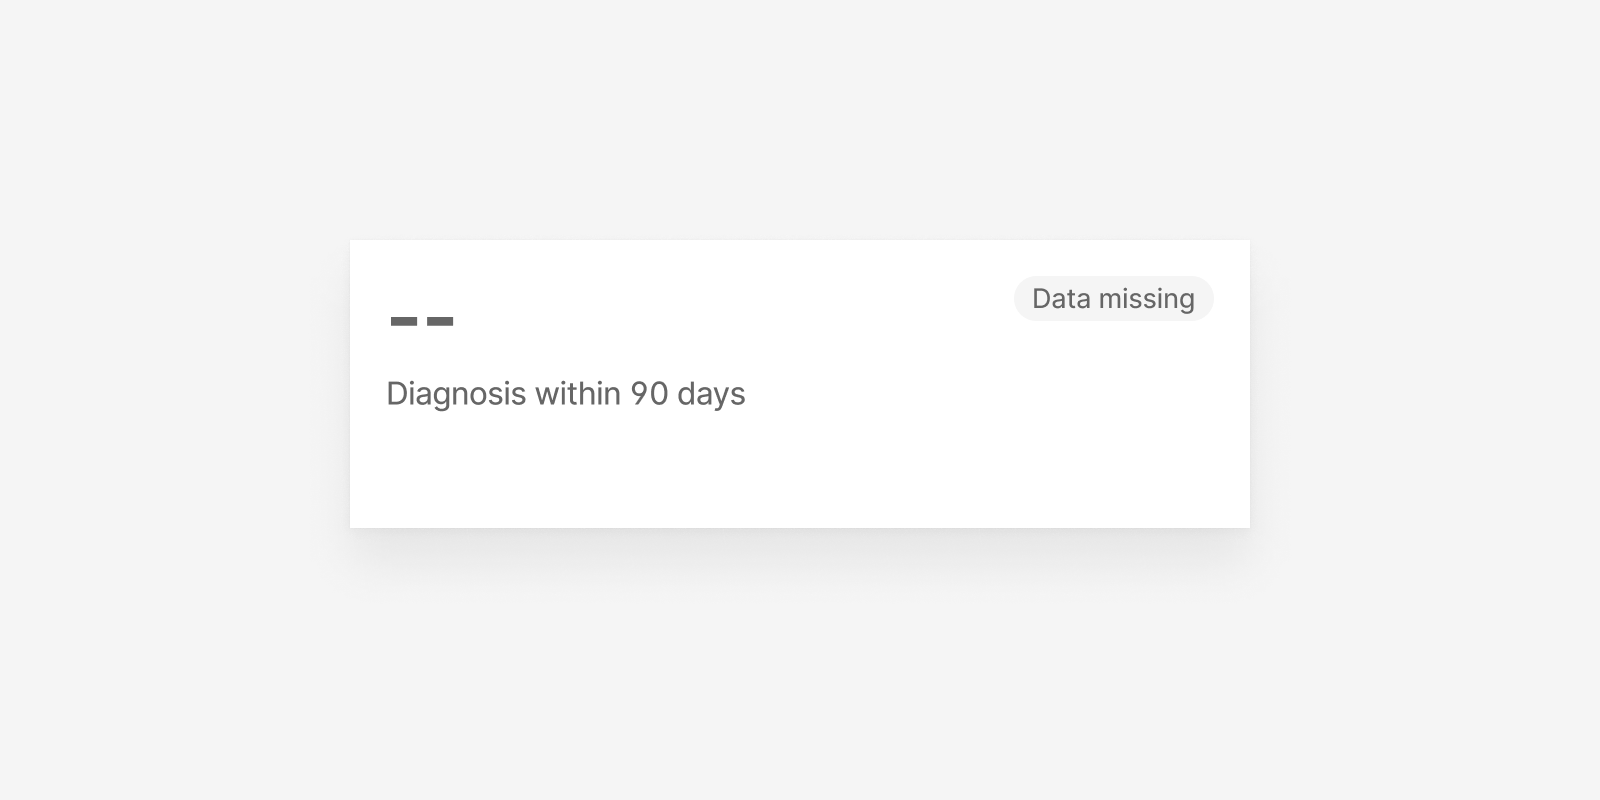
Data missing
There is a status for key figures when data is missing. This status can appear when there is not enough data to display a figure.
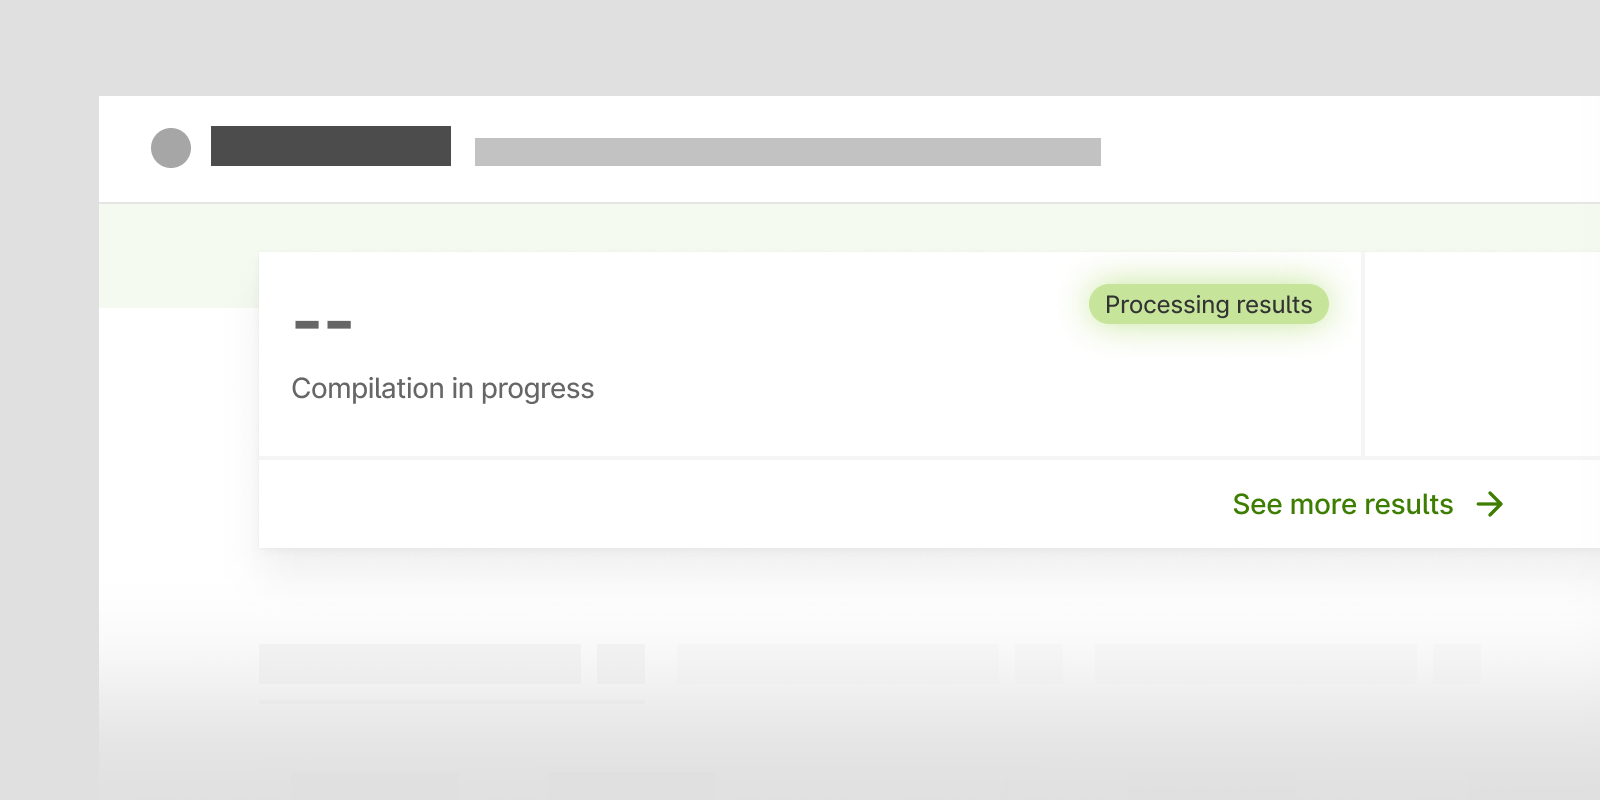
SAS processing data
Another status is when SAS is processing the data for the key figures.
Usage
The key figure panel is optional to use. Our recommendation is to show at least 2 and a maximum of 5 key figures for a registry.
The key figures apply to the current unit. It is possible to configure so that different unit types have different key figures.
It is strongly recommended that the key figures are also included in one of the registry's reports, so that users can proceed for more in-depth information.
Time interval
The default setting for the time interval is 12 months back, but it can be changed by the registry. Note that the time interval applies to all key figures that the registry chooses to display, which is why it is decisive when selecting key figures.
For those of UCR's registries where the SAS analysis environment is used for calculation, all key figures are displayed up to and including yesterday's date.
For registries that do not use any external analysis environment, the key figures are displayed up to and including today's date.